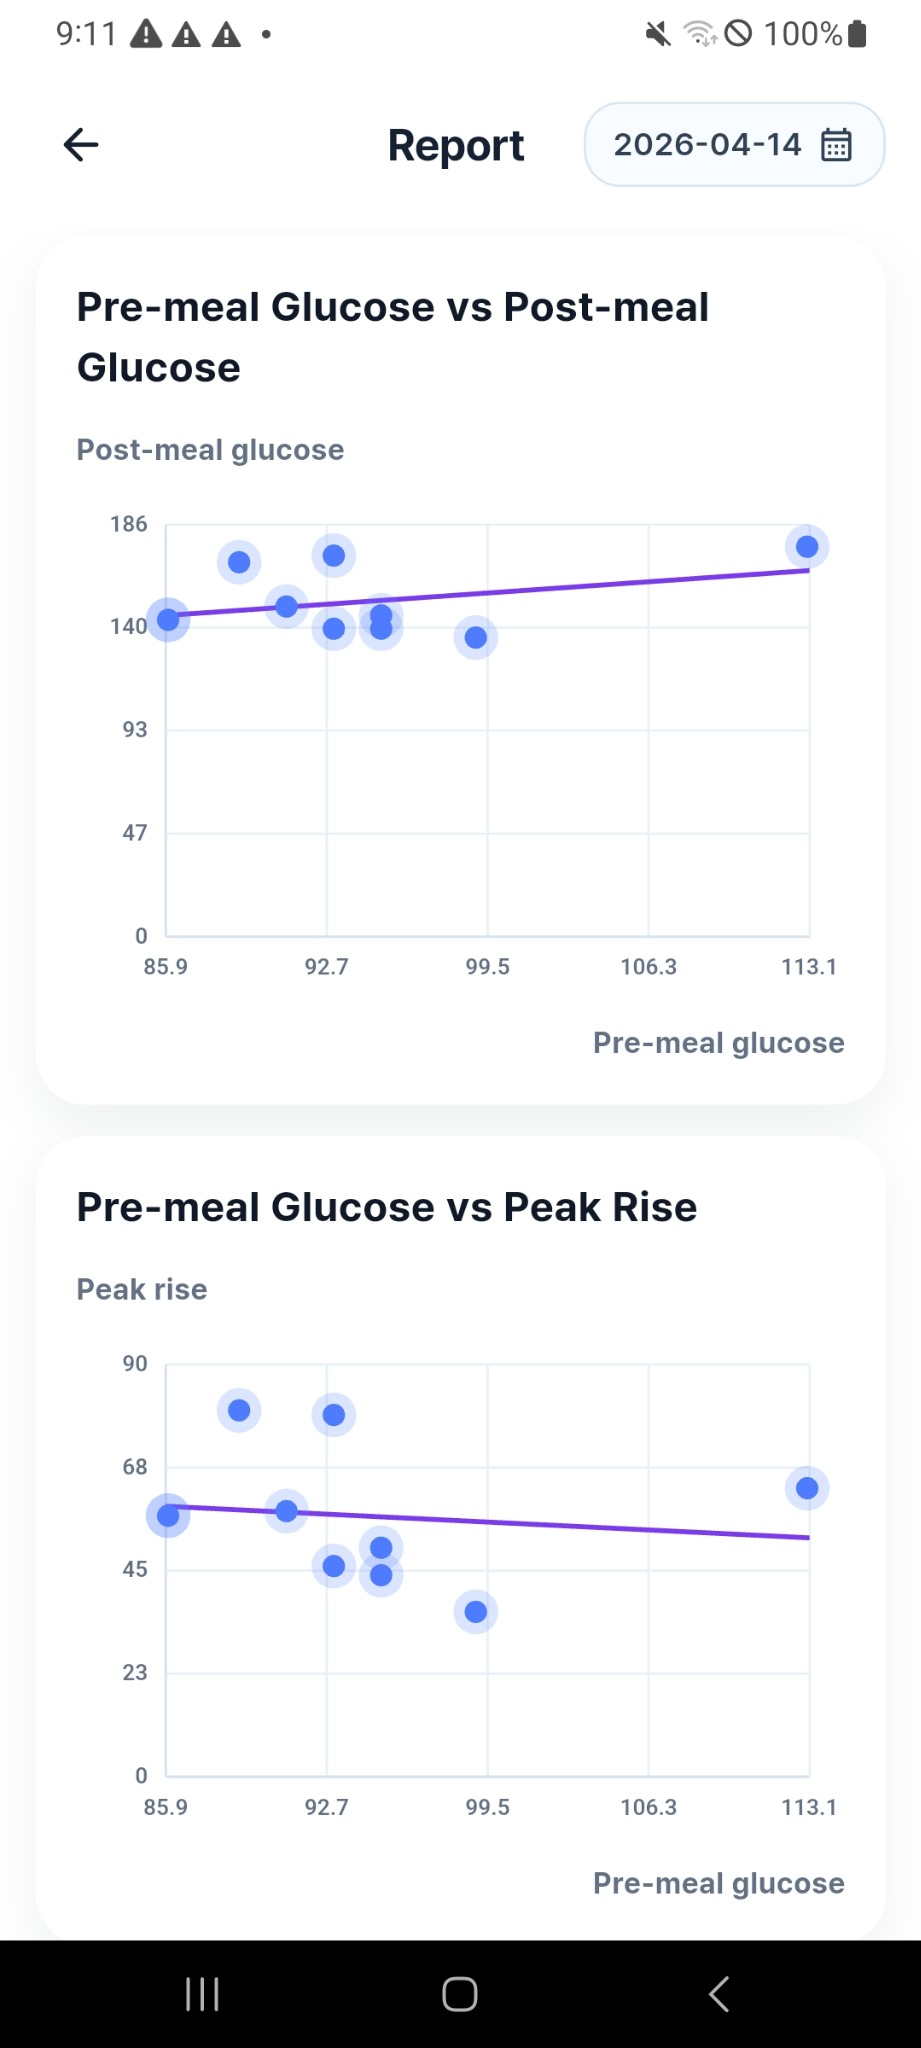
The difference between preprandial blood sugar and postprandial blood sugar is analyzed more intensively.
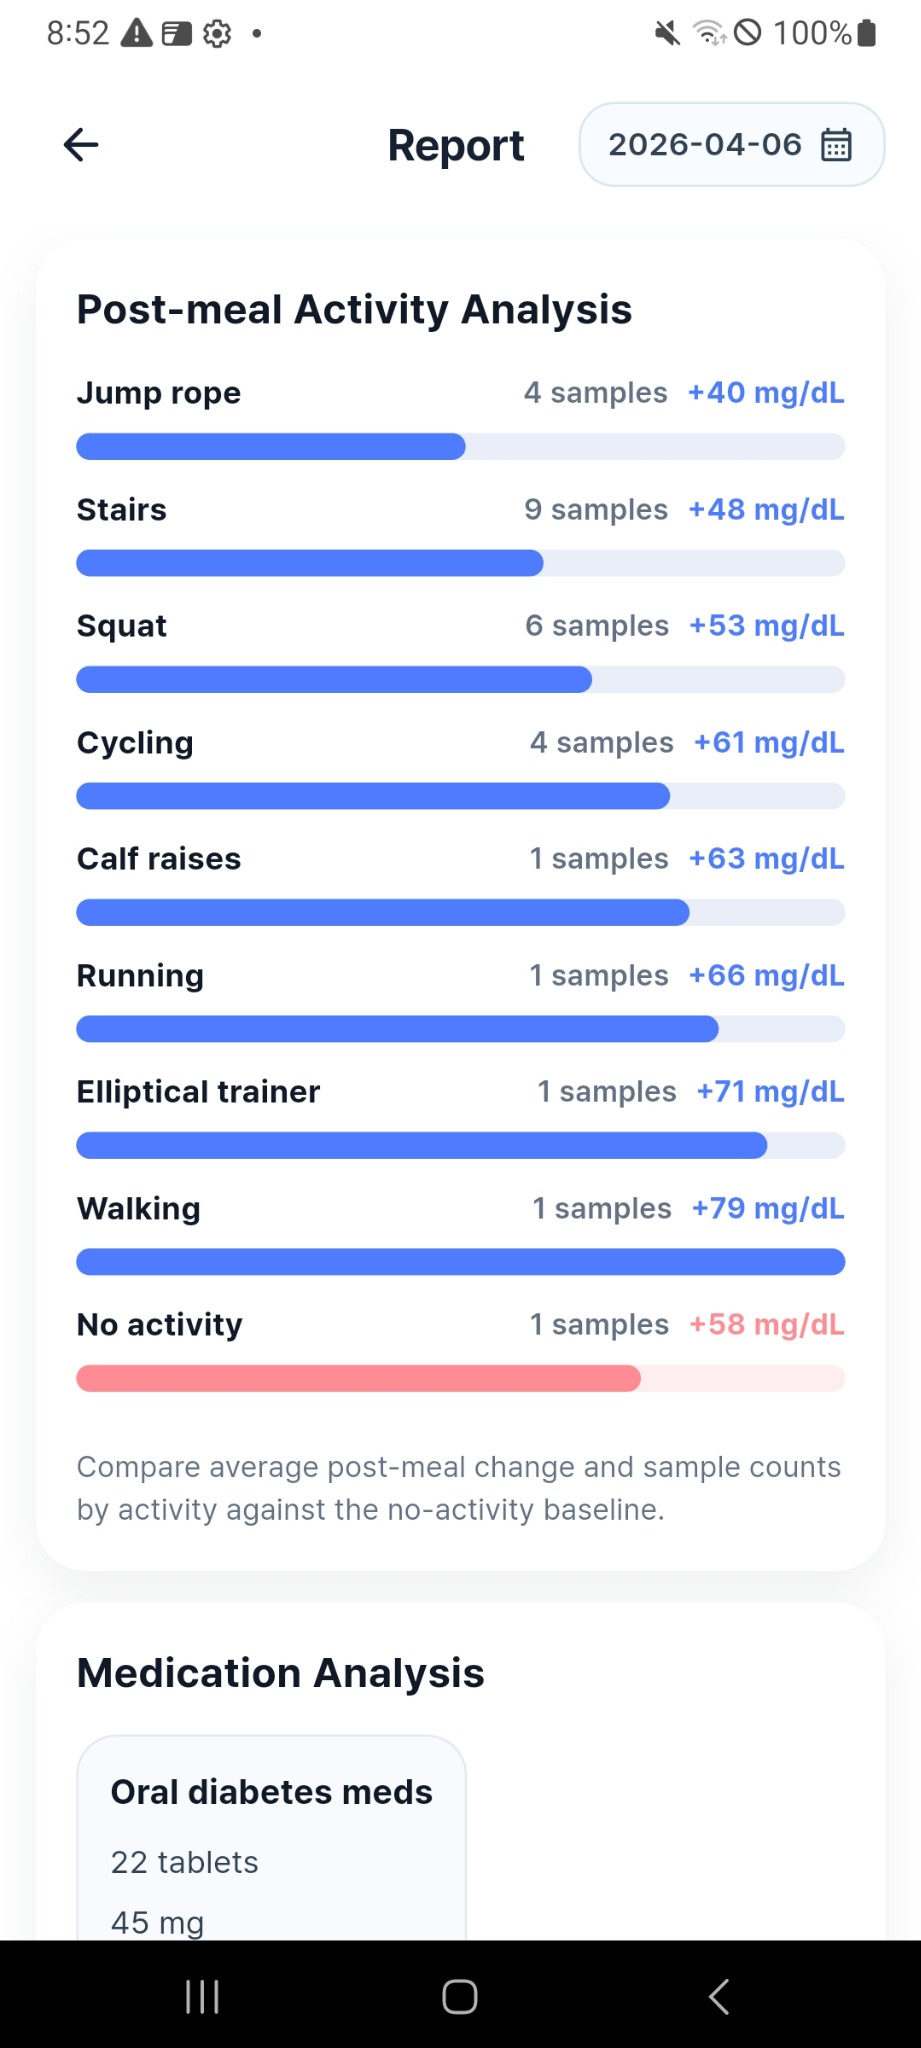
Insights are designed to help users read the report layer, not only the dataset layer. This is where broader interpretation starts to become useful.